Saturday, February 5, 2011

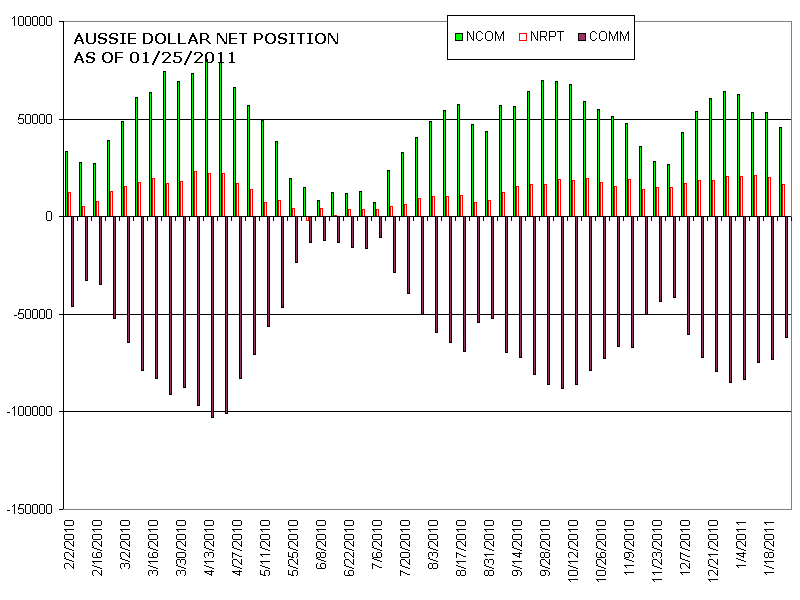
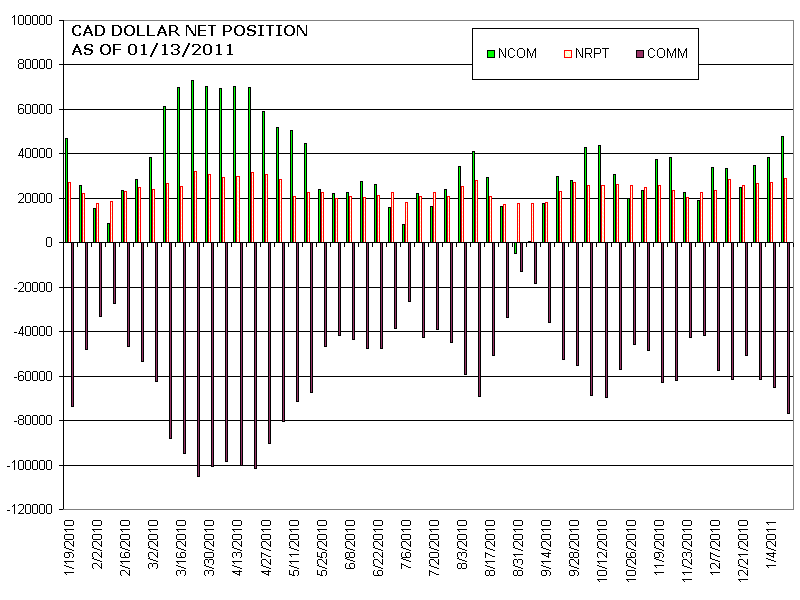
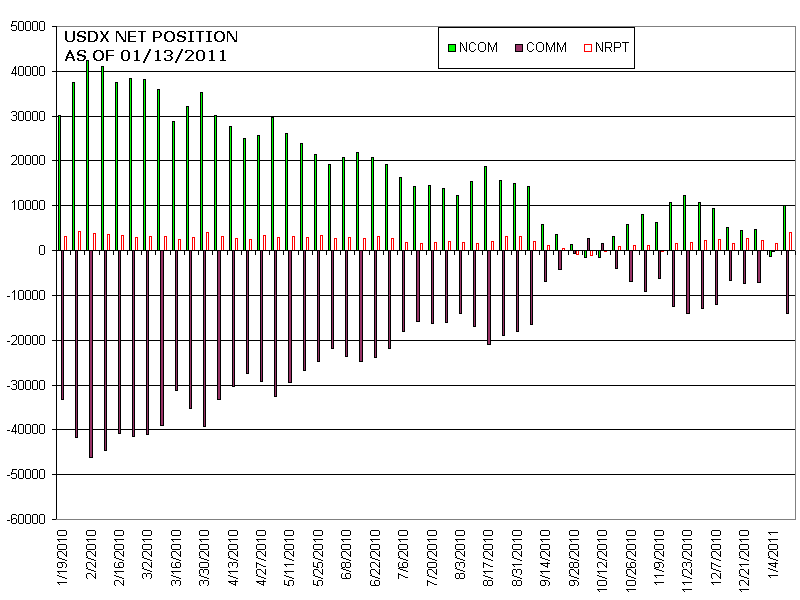
Commitment of Traders (COT) Reports - 02/01/2011

I love looking at the COT reports despite their obvious limitations; although they contain data three days old, they do provide an excellent window into market sentiment. Take for example the E-Mini COT report. For the past couple of weeks we have been noticing an increase in net-positive positions of the non-commercials - just as the S&P500 has been steadily moving closer to a major resistance level: 1300. As I mentioned in a post from two weeks ago, the shift in net-positive positions indicated that the S&P had some room to stretch. This week, the S&P not only managed to break above the 1300 level but also managed a Friday close above this level.

Commitment of Traders reports are far from being a magic crystal ball to predict the future. But taken in the right context, they can help us frame a short term bias.

Highlights of this week's COT reports:
  • S&P E-Mini's report showing yet another increase in net-positive positions.
  • EUR net positive positions increase, while DXY positions are now negative (for non-commercials)
  • Ten Year Notes register another increase in net-short positions - suggesting further rate increase in the 10YR benchmark (bye, bye, cheap mortgage rates?)
  • Crude net-positive positions stay elevated - not expecting to see any decline in oil prices in the near future.
 Click on images below to enlarge:


Sunday, January 23, 2011

Commitment of Traders (COT) Reports - 01/18/2011

This week's COT reports show a mixed signal for the S&P E-minis. The euro, however, seems undeniably stronger: non-commercials have switched from a considerable net short position to a  net long position. The same, albeit on a smaller scale, can be seen on the GBP report. This suggests more USD weakness is on the cards this week.

Click on images to enlarge:


Sunday, January 16, 2011

Commitment of Traders (COT) Reports - 01/13/2011

Two noteworthy COT charts this week:
  1. S&P 500 E Mini - For the first time since August is displaying net positive position for non-commercials, signaling that the S&P has a little more room to stretch upwards as it begins to flirt with a major resistance level of 1300
  2. USDX - Sharp increase in net positive positions for non-commercials indicate the dollar will have the upper hand in the coming days, at least against the Euro
Click on the images below to enlarge.

PS - The data in the chart is as of 1/11/2011 (latest COT data) and not 1/13/2011


Thursday, November 25, 2010

AUDCAD Head and Shoulders Completed

Just a textbook Head and Shoulders pattern: (target of measured move is somewhere near 0.9600)

Wednesday, November 24, 2010

AUDCAD Forming a Head and Shoulder on the 4HR Chart

After a relentless run up in favor of AUD, AUDCAD is showing some signs of slow down and looking like it's forming a head and shoulders pattern on the 4hr chart:

Sunday, October 24, 2010

The 15 Year Swing

Swing traders are probably the most patient breed of Market players. Rather than taking part in a short, medium, or long term trend, they wait with extreme discipline for price to reach a level that previously proved to be a substantial turning point. Commonly referred to as Support and Resistance or Demand and Supply levels, these price levels mark the origin of a past sharp and sustained move in price.Price may drift above or below such levels for hours, days, weeks or months before returning to test them. Once they identify a quality turning point in price, swing traders will wait for the price to re-test that level, using it to define risk and potential reward.

Taking a look at the USDJPY pair, we can see a swing trade that, like a good Single Malt, is 15 years in the making. The Japanese yen has recently reached levels against the USD not seen in more than a decade and a half. On its last visit to this multi-year low, USD turned around and pushed higher against the yen for more than 3 years. This can be clearly observed in following monthly chart:


Zooming in on a 4 hour chart we can see that price is indeed finding some support at this important and broadly watched level:


This current level is an appealing long entry with a clearly defined risk (80.85) and an excellent chance for price to move up at least far enough for us to move a trailing stop comfortably above the entry level (80.12).