
Thursday, November 25, 2010
AUDCAD Head and Shoulders Completed
Just a textbook Head and Shoulders pattern: (target of measured move is somewhere near 0.9600)

Wednesday, November 24, 2010
AUDCAD Forming a Head and Shoulder on the 4HR Chart
After a relentless run up in favor of AUD, AUDCAD is showing some signs of slow down and looking like it's forming a head and shoulders pattern on the 4hr chart:


Sunday, October 24, 2010
The 15 Year Swing
Swing traders are probably the most patient breed of Market players. Rather than taking part in a short, medium, or long term trend, they wait with extreme discipline for price to reach a level that previously proved to be a substantial turning point. Commonly referred to as Support and Resistance or Demand and Supply levels, these price levels mark the origin of a past sharp and sustained move in price.Price may drift above or below such levels for hours, days, weeks or months before returning to test them. Once they identify a quality turning point in price, swing traders will wait for the price to re-test that level, using it to define risk and potential reward.
Taking a look at the USDJPY pair, we can see a swing trade that, like a good Single Malt, is 15 years in the making. The Japanese yen has recently reached levels against the USD not seen in more than a decade and a half. On its last visit to this multi-year low, USD turned around and pushed higher against the yen for more than 3 years. This can be clearly observed in following monthly chart:

Zooming in on a 4 hour chart we can see that price is indeed finding some support at this important and broadly watched level:

This current level is an appealing long entry with a clearly defined risk (80.85) and an excellent chance for price to move up at least far enough for us to move a trailing stop comfortably above the entry level (80.12).
Sunday, April 25, 2010
Commitment of Traders (COT) Reports - 04/20/10
Here are the latest COT reports from 4/23/2010. The data is as of Tuesday 4/20. The graphs show the net positions for Commercials (hedgers) Non-Commercials (large speculators), and Non-Reportables (smalls speculators).
Perhaps the most interesting report is for the S&P 500 e-mini COT. Notice how the non-reportables are at odds (net long) with the non-commercials (net short). This is may be an indication of "dumb" money vs. "smart" money situation where astute players are distributing and not-so-smart, small players buy. I know I have already commented about the dangers of being bearish in the face of such a relentless uptrend but, as we learned in 2008, better safe and sorry than burned and full of regret.
Also interesting to note, continued bearish sentiment for the Euro but slightly less bearish sentiment for the British Pound.JPY sentiment is still net-short.
So, without further ado, here are the graphs:


Saturday, April 17, 2010
Commitment of Traders (COT) Reports - 04/13/10


Sunday, April 11, 2010
Monday, April 5, 2010
Strong Economic Data and the Fed
The ISM and Pending Home sales came in stronger than expected. The strong reports come on the heels of the strongest employment report in months. In addition, the US has averted a head-on confrontation with China with respect to its currency policies. The confluence of these events contributed to the already evident risk appetite in currencies and equities. Treasuries continued to suffer and the yield on the 10yr note is approaching a nine month high.
The question on everyone's mind is: how will the Fed react to the positive stream of economic data? We already noted the much anticipated discount rate hike that is expected to take place later today. But for Fed watchers, the big one is, the Fed's "extended period" language. The yield on the 10yr note approaches a major resistance level. We can make the argument that the high probability event is for the yield to hit its resistance level and pull back. There are a couple of scenarios which may lead to lower yields. the more likely scenario is a change in the Fed's language or some other hawkish gesture. It would seem like the market has already made up its mind about the trajectory of the recovery and the Fed will be careful not to fall behind the curve. Only when the Fed's training wheels come off will we know whether the recovery has legs to stand on.
The current environment is favorable for the USD against the euro, British pound, and mainly the JPY. But commodity currencies, CAD in particular, can be expected to get stronger across the board.
Sunday, April 4, 2010
Welcome to Q2!
For the past couple of weeks I have been a little cautious, expecting to see a pullback in risk appetite and for the past couple of weeks I have been proven wrong. Last week I noted the danger of entrenching myself in a bearish outlook. The uptrend in stocks is strong, and the rising bond yields appear to be a result of confidence in the recovery rather than loss of confidence in US credit worthiness. While we can't predict the future, we can try to make the best decisions based on the information we have (I think that's a line from Wedding Crashers). So, here's what we know:
Fed will continue to normalize - the Fed has ended its $1.25 trillion mortgage backed securities (MBS) program. A recent Bloomberg article suggested that industry buyers such as banks and pension funds stand ready to step into the MBS market and will be able to fill in the void left by the Fed. In such a scenario, mortgage rates increases may be negligible.
The Fed is also widely expected to raise the discount-rate tomorrow (Mon, April 5th). This will be the second increase this year. The first hike on Feb 18 (+0.25% to 0.75%) was had a muted impact on the stock market but boosted the USD.
The FOMC will release its meeting minutes this coming Tuesday at which point we will have a better idea on how the latest job figures and rising bond yields affected the Fed's outlook.
Economy continues to improve - Non-farm payroll, ISM manufacturing index, Case/Shiller index, declining 10yr notes, and improving prices of mortgage backed bonds, in particular the infamous 2006 vintage (see ABX.HE.AAA.06-2 chart below), all point to the continuation of positive momentum. These incremental improvements supply the Fed with the ammunition it needs to continue and implement its exit strategy.

Inflation is still in check - PPI and CPI figures for March tempered some of the expectations out there for impending inflation. One has to keep in mind that while the Fed did "print" vast amounts of money during the crisis, equally vast (and probably greater) amounts of dollars were literally evaporated from the world economy. Thus, the supply of money is likely still contracted compared to what it was pre-2007.
Now that we've covered some of the information available to us, let's try to frame our bias for the week.
US Dollar - conditions are still favorable for the US dollar. As noted above, improving economic conditions will guide the Fed further down its exit path which is bullish for the dollar, especially since the BoE, ECB, and BoJ are still sounding dovish. Technically, the USD index (DXY) is cruising confidently within an upward channel (see image below). In fact, as of Sunday night, the DXY is seen bouncing off its lower channel line. I will stay bullish on the USD as long as it stays above 80.50 and does not breach its 50 MA (black line in the chart below)

Euro - The "anti-dollar" experienced a moderate relief advancing against the greenback for most of the week. Interestingly enough, Greek/German spread also rose at the same time, suggesting the euro's gains were mostly related to short covering rather than any fundamental improvements. As I write this, the euro is pushing against a weekly trend line. If it manages to break the trend, we may see it advance to 1.3660 or as far as 1.3800. But the bearish sentiment (as evident by the COT reports) suggest that euro rallies will be met with renewed selling pressure.
GBP - the British pound performed better against the USD than the euro. UK manufacturing data and a somewhat clearer political outlook pushed the pound higher against the dollar and euro. We can expect sustained strength against the euro but not necessarily against the dollar. The GBP/USD failed to break above the 1.5360 level. Until this resistance is taken out, we will remain negative on GBPUSD.
Japanese Yen - perhaps the most attractive opportunities this week/month will be shorting JPY pairs. As I noted several times in the past couple of weeks, JPY was expected to weaken as of the end of March. The COT report exposes a major shift in sentiment from net-long to net-short positions for Non-Commercials. The bet is on and its against the Yen. CADJPY has been one of the best performing pairs and we should expect to see it rally further.
Commodity Currencies - I still prefer the loonie over the aussie. The differential will be more pronounced if we experience a breakout in oil prices above $85/barrel.
S&P 500 - as for the S&P, the road up seems clear but the closer we get to 1200, the more likely we are to experience a meaningful correction. By this point, we can assume that all the good news is already baked into the cake, so cheerful economic data may not suffice to lift the stock market higher.
I will try to post updates tomorrow after the ISM and Home sales figures (10am EST) and another one after the FOMC release on Tuesday to adjust my views. In addition, I plan to add a new section to the site, something like "chart of the day" where I will try to identify specific trading opportunities based on some simple rules.
Fed will continue to normalize - the Fed has ended its $1.25 trillion mortgage backed securities (MBS) program. A recent Bloomberg article suggested that industry buyers such as banks and pension funds stand ready to step into the MBS market and will be able to fill in the void left by the Fed. In such a scenario, mortgage rates increases may be negligible.
The Fed is also widely expected to raise the discount-rate tomorrow (Mon, April 5th). This will be the second increase this year. The first hike on Feb 18 (+0.25% to 0.75%) was had a muted impact on the stock market but boosted the USD.
The FOMC will release its meeting minutes this coming Tuesday at which point we will have a better idea on how the latest job figures and rising bond yields affected the Fed's outlook.
Economy continues to improve - Non-farm payroll, ISM manufacturing index, Case/Shiller index, declining 10yr notes, and improving prices of mortgage backed bonds, in particular the infamous 2006 vintage (see ABX.HE.AAA.06-2 chart below), all point to the continuation of positive momentum. These incremental improvements supply the Fed with the ammunition it needs to continue and implement its exit strategy.
Inflation is still in check - PPI and CPI figures for March tempered some of the expectations out there for impending inflation. One has to keep in mind that while the Fed did "print" vast amounts of money during the crisis, equally vast (and probably greater) amounts of dollars were literally evaporated from the world economy. Thus, the supply of money is likely still contracted compared to what it was pre-2007.
Now that we've covered some of the information available to us, let's try to frame our bias for the week.
US Dollar - conditions are still favorable for the US dollar. As noted above, improving economic conditions will guide the Fed further down its exit path which is bullish for the dollar, especially since the BoE, ECB, and BoJ are still sounding dovish. Technically, the USD index (DXY) is cruising confidently within an upward channel (see image below). In fact, as of Sunday night, the DXY is seen bouncing off its lower channel line. I will stay bullish on the USD as long as it stays above 80.50 and does not breach its 50 MA (black line in the chart below)

Euro - The "anti-dollar" experienced a moderate relief advancing against the greenback for most of the week. Interestingly enough, Greek/German spread also rose at the same time, suggesting the euro's gains were mostly related to short covering rather than any fundamental improvements. As I write this, the euro is pushing against a weekly trend line. If it manages to break the trend, we may see it advance to 1.3660 or as far as 1.3800. But the bearish sentiment (as evident by the COT reports) suggest that euro rallies will be met with renewed selling pressure.
GBP - the British pound performed better against the USD than the euro. UK manufacturing data and a somewhat clearer political outlook pushed the pound higher against the dollar and euro. We can expect sustained strength against the euro but not necessarily against the dollar. The GBP/USD failed to break above the 1.5360 level. Until this resistance is taken out, we will remain negative on GBPUSD.
Japanese Yen - perhaps the most attractive opportunities this week/month will be shorting JPY pairs. As I noted several times in the past couple of weeks, JPY was expected to weaken as of the end of March. The COT report exposes a major shift in sentiment from net-long to net-short positions for Non-Commercials. The bet is on and its against the Yen. CADJPY has been one of the best performing pairs and we should expect to see it rally further.
Commodity Currencies - I still prefer the loonie over the aussie. The differential will be more pronounced if we experience a breakout in oil prices above $85/barrel.
S&P 500 - as for the S&P, the road up seems clear but the closer we get to 1200, the more likely we are to experience a meaningful correction. By this point, we can assume that all the good news is already baked into the cake, so cheerful economic data may not suffice to lift the stock market higher.
I will try to post updates tomorrow after the ISM and Home sales figures (10am EST) and another one after the FOMC release on Tuesday to adjust my views. In addition, I plan to add a new section to the site, something like "chart of the day" where I will try to identify specific trading opportunities based on some simple rules.
Commitment of Traders (COT) Reports - 03/30/10
These are the April 2nd 2010 COT reports, containing data as of March 30th 2010. Graph show net positions for Commercials (hedgers), Non-Commercials (large speculators), and Non-Reportables (small speculators).
Highlights for this weeks reports:
1. S&P 500 e-mini - still seeing divergence between non-reportables (increased net long position) and non-commercials (still net short). As indicated last week, this divergence is a warning sign that large speculators are trimming long positions as small traders pile in on the long side.
2. USDX COT report - shows an increase in non-commercial positions.
3. EUR and GBP - COT reports for both show increase in non-commercial short positions, reflecting the sustained bearish sentiment.
4. Commodity currencies and Crude Oil - Bullish net-long positions persist for the Loonie, Aussie, and Crude oil.
5. Japanese Yen and 10 Yr Notes - perhaps the most telling COT reports this week are the Yen and 10yr Notes reports. Both show a dramatic increase in net-short positions.


Sunday, March 28, 2010
Looking Ahead
Last week was a busy one for financial markets in general and FX markets in particular. The dollar staged another advance across the board and the DXY notched a new high. The euro broke to new lows and the British pound remained under pressure. Yen lost ground across the board as stocks continued to rise alongside yield differentials.
One of the most important and most interesting developments is the rise in Treasury yields, esp. the 10 Yr notes. There are at least two relevant questions to be asked: What is driving the yields? and what are the possible effects. One possible explanation for the yield rise is that the market is pricing in a continued recovery which will, eventually, contribute to rising interest rates. Another possible explanation is that buyers of treasuries are simply bloated. With growing deficits (trade and budget) a huge supply of notes, and concerns over the future of US credit rating, the market may simply be asking for a higher risk premium to hold US debt. In either scenario, the short term expectation is bullish for the dollar.
Greece is expected to issue new bonds this week. The result of this auction will be telling and we will get a better idea as to whether or not the market puts any stock in the recently announce rescue deal for Greece.Either way, we should still expect euro rallies to serve traders as opportunities to reload their shorts rather than a trend reversal. Same goes for the British pound.
Yen was weaker across the board and this is expected to continue as long as we don't get into risk aversion mode. I have been using the S&P 500 as one measure of risk appetite and for the time being, it seems due for a pullback. I know I have been cautious since the middle of March and I also realize the danger in adopting a bearish bias - the more time passes, the more liable I am to become entrenched in my position, waiting for a correction which may only come much, much later. Having said that, I still maintain my view that a short term pullback in the stock market is immanent and may have already started last week. The market climbed a wall of worry and it will descend a wall of reassurance. This is how the game is played. The S&P COT report also shows large speculators being net short for the first time in month - another red flag. The only positive for stocks at this time are the rising yields in bonds. If bonds loose their luster because the marker is pricing in a sustained recovery, we may witness a major capital reallocation from bonds to higher yielding assets like stocks and commodities.
Traveling today so no charts with this post.
Saturday, March 27, 2010
Commitment of Traders (COT) Reports - 03/23/10
These are the March 26 reports containing data as of 03/26/10. COT graphs below show net positions for Commercials (hedgers), Non-Commercials (large speculators), and Non Reportables (small speculators).
Highlights of this week's COT reports:
1. S&P (e-mini) COT Report - For the first time since October 2008, large speculators are net short. Interestingly, small speculator turned net positive this week for the first time in months. This divergence shows that smart money (non-commercials) and dumb money (non-reportables) are at odds. Isn't that the oldest story on Wall st? If what we are seeing is indeed real distribution -the process in which large players trim down profitable positions- the question must be asked: can the retail investor prop the market's momentum? At any rate, this is definitely a red flag!
2. USD COT Report - Extreme net long positions persist. This week's reading slightly higher than last week.
3. Euro COT Report - New selling pressure is evident in the increased net short positions.
4. GBP COT Report - Extreme bearishness persists and net short positions are at new highs.
5. Commodity Currencies - Both the Aussie and Loonie's COT reports show extreme net long positions are still sustained.
6. JPY COT Report - Net long speculative positions continue to decline.
7. As of this week, I am adding two new reports: Crude Oil and 10 Yr Notes.
CLICK TO VIEW LARGER IMAGE


Friday, March 26, 2010
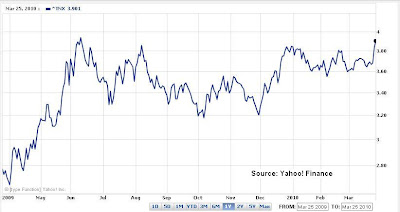
Rising Yields Cement Dollar's New Highs
Positive developments yesterday (Thursday) sent stocks and the USD higher. While stocks gave up their gains during the last hour of trading, the dollar remained strong. The greenback gained against all its major counterparts, including the commodity currencies, aided by rising Treasury yields. Here's a quick recap of yesterday's news:
The potential Greece rescue deal continues to expose deep divides within the EU. It's getting pretty clear at this point that the clock is ticking and something must be done to prevent contagion. After all, the EU cannot afford to let Greece go down the path of Lehman Bros. Therefore, it is safe to assume that under pressure, EU leaders will announce a detailed deal within the next 48 hours. Depending on its conditions, the deal may provide a short relief to the euro but any rally is likely to fade quickly. Greek/German spread have actually come down since late January as the euro continued its precipitous decline. So a fix for Greece may not be a cure for the euro. So much of Europe's destiny is riding on perception. There will be buyers for Greek (Italian, Portuguese, Spanish) debt. The question is, at what cost? If risk perception is high, the cost of borrowing will be high - perhaps high enough to actually drive some of these sovereign nations to the brink.
As noted in previous post, 1175 was seen as the next resistance for the S&P and, indeed, the broad market index was unable to sustain this level. It is important to mention that this was more of a "psychological" level rather than a purely technical resistance/supply zone. The S&P finished the day with a very bearish candle formation, suggesting more downside may follow. After a nearly two month wild rally, and a rising VIX we should not be surprised to see a 1%~2% pullback to the 1150-1130 area. Falling stocks should weigh on commodities and commodity currencies and we may continue to see the Aussie and loonie lose more ground to the almighty (for now) dollar. AUDUSD chart indicates downside risk:

- Unemployment numbers came in slightly better than expected.
- Strong earnings/guidance from Best Buy and Qualcomm.
- Citi gained on news suggesting the Treasury will unveil a plan to sell its stake in the bank.
- Bernanke gave the market another fix of its favorite drug - commitment to keeping easy, cheap money flowing.
- France, Germany find common grounds for Greece assistance package involving the IMF (but euro makes new lows)

The potential Greece rescue deal continues to expose deep divides within the EU. It's getting pretty clear at this point that the clock is ticking and something must be done to prevent contagion. After all, the EU cannot afford to let Greece go down the path of Lehman Bros. Therefore, it is safe to assume that under pressure, EU leaders will announce a detailed deal within the next 48 hours. Depending on its conditions, the deal may provide a short relief to the euro but any rally is likely to fade quickly. Greek/German spread have actually come down since late January as the euro continued its precipitous decline. So a fix for Greece may not be a cure for the euro. So much of Europe's destiny is riding on perception. There will be buyers for Greek (Italian, Portuguese, Spanish) debt. The question is, at what cost? If risk perception is high, the cost of borrowing will be high - perhaps high enough to actually drive some of these sovereign nations to the brink.
As noted in previous post, 1175 was seen as the next resistance for the S&P and, indeed, the broad market index was unable to sustain this level. It is important to mention that this was more of a "psychological" level rather than a purely technical resistance/supply zone. The S&P finished the day with a very bearish candle formation, suggesting more downside may follow. After a nearly two month wild rally, and a rising VIX we should not be surprised to see a 1%~2% pullback to the 1150-1130 area. Falling stocks should weigh on commodities and commodity currencies and we may continue to see the Aussie and loonie lose more ground to the almighty (for now) dollar. AUDUSD chart indicates downside risk:

Thursday, March 25, 2010
Introducing Bloomberg "Hacks" Page
Bloomberg.com provides tremendous amounts of information and financial data, but it's not always easy to find or search for. Although virtually all of the data on bloomberg.com (the public site) is delayed, it can still be a valuable resource in assessing long term trends and shed light on current events. For example, you may look at German/Greek spreads to measure the risk premium investors charge to buy Greek debt. Likewise, you may look at the commercial CMBs spreads over treasuries to assess the commercial real-estate sentiment.
I decided to dedicate a separate page to keep track of this information. I will update the page periodically. If you have any suggestions on how to make it better or additional links that can be added, please let me know.
Thanks!
http://forexroy.blogspot.com/p/bloomberg-hacks.html
I decided to dedicate a separate page to keep track of this information. I will update the page periodically. If you have any suggestions on how to make it better or additional links that can be added, please let me know.
Thanks!
http://forexroy.blogspot.com/p/bloomberg-hacks.html
Wednesday, March 24, 2010
Blame it on the Weather
So, it was a really amazing weekend in New York and I was out and about, which explains the absence of my weekly summary/forecast post on Sunday. I have been pretty disciplined about writing my weekend review so I almost forgot how important it was. It is absolutely imperative to review the week that was, study the weekly and monthly charts, take into account recent fundamental developments and anticipate the markets direction based on the charts and calendar of economic events. Then, it is important to take all of that and formulate a working hypothesis for the week - a set of assumptions to frame our trading decisions. Personally for me, it is also important to do all of this on the weekend, when the market is closed and after spending at least 24 hours away from my monitor.
Well, better late than sorry so in lieu of the Sunday review, here's a little mid-week recap - a sort of Tuesday night quarterbacking, if you will. Here we go:
S&P 500
The S&P finished last week above 1150. This was largely seen as a bullish sign with a Friday confirmation close above a strong resistance level. However, until today (Tuesday) the S&P was not able to close above 1166, the resistance level we've identified days ago. Today's break above 1166 was decisive and happened toward the end of the day. It definitely looked like a good number of stop entries triggered on a break above 1170. At any rate, the next short term support/resistance levels for the S&P are 1175 and 1150. A break below 1150 might accelerate selling pressure with support seen at 1130 and 1115. This means that we are currently just a fraction of a point from another resistance level. A pullback at this point is all but certain. But hey, I could be wrong. The question is, what is the catalyst to push the market up or down. For sure, the Fed's commitment to keep rates low is a major factor. On the other hand, the Fed will end its MBS (mortgage backed securities) purchase program this month. No one knows for sure how it will impact mortgage rates and, in turn, real-estate prices but we already know that uncertainty and risk appetite do not go hand in hand. At any rate, if I set my bearish bias aside and just look at the chart, it looks like S&P is set to drift higher to 1200.
USD Index (DXY)
The strong inverse correlation that dominated the relationship between the USD and the S&P for much of 2009 seems like a distant memory. The relatively strong US recovery stands in stark contrast to the situation in the EU and the UK. This macro environment allowed US equities to rise to new monthly highs in tandem with the US dollar. One can only imagine that in a risk aversion scenario, the gap between the USD and the euro/GBP would be even greater - arguably, in such environment, the USD will stand to gain not only against the weak euro and GBP but also against the strong loonie, aussie, and Swiss franc.
As previously noted, the euro and GBP make up nearly 70% of the basket of currencies against which the DXY is calculated. This means that most of the recent strength in the DXY is due to weakness in the euro and pound, both of which face lingering issues and may suffer further weakness.

Euro - Greece
Germany's Merkel changed her stance a couple of days ago when she asserted that the IMF may be the only way to extend help to Greece. At the time the news came out, I thought a good chance for some relief to Greece and the euro was on the cards but that was not the case. A new round of political bickering commenced which helped push the euro even lower. The euro declined to new monthly lows against the Aussie and Swiss franc. As I write these lines, EURUSD is flirting with its 1.3450 support. A break below this level will most certainly trigger some stop sell orders waiting to be activated and send the euro even lower.
Only a clear plan for Greece and a cohesive EU stance can save the euro from sliding further. Euro sentiment remains bearish until then.
British Pound
The GBP suffered a massive slide on the backdrop of a weak UK economy coupled with an upcoming elections and accented with dovish BoE comments. At one point the pound even weakened against the euro. New economic data released today didn't help. Technically speaking, the pound looks the most vulnerable for further decline. At this very moment (3/24/09, midnight), GBPUSD seems well on its way to retest recent support at 1.4880 - 1.4800.
Japanese Yen
The yen maintained most of its strength despite the new highs in equities. As previously noted, at least some of the yen's strength should be attributed to repatriation which should abate by the end of the month, leaving the yen (risk appetite permitting) vulnerable.
Commodity Currencies
The loonie and Aussie continued to dominate the scene, with the loonie outpacing its Australian counterpart. The thought her is that the Aussie is vulnerable to further Chinese tightening but the Canadian dollar is less so. In addition, BOC has yet to raise interest rates while the RBA may not be willing to go much higher at this point.
OK - That's all for the time being. To be continued tomorrow....
Thursday, March 18, 2010
Euro May Find Support as Germany Signals IMF Help for Greece Appropriate
EU leadership has been reluctant to even consider the possibility of IMF support for Greece - until today. Germany signaled IMF help may be appropriate after all. The idea is not without merit. The IMF can act somewhat independently of convoluted European politics. In addition, the EU will not be setting a dangerous precedence with a Greek bailout. IMF assistance may or may not be the best solution for Greece. But for the euro, that is not what really matters. What matters for the euro is a decisive plan of action that will put an end to weeks of political bickering.
The euro suffered some its worse one day declines on Thursday but as of this evening, EURUSD found support around 1.36 which coincided with Germany's comments regarding Greece and the IMF. A decisive plan of action, even if it eventually fails, will undoubtedly stoke a euro relief rally and pressure the US dollar.
The euro suffered some its worse one day declines on Thursday but as of this evening, EURUSD found support around 1.36 which coincided with Germany's comments regarding Greece and the IMF. A decisive plan of action, even if it eventually fails, will undoubtedly stoke a euro relief rally and pressure the US dollar.
USD On The Move
US dollar is visibly stronger today across the board. The most obvious factor here is the failed Greek bailout plan. Euro dollar is the most widely traded currency pair and the euro is the biggest component of the DXY, the basket of currencies widely used to measure the dollar's strength. As such, material weakness in the euro will translate to USD strength against most of its trading counterparts.
Technically, the DXY chart looks strong. Despite a break below its recent channel (see chart below), the index bounced off its 50 day MA and, more importantly, bounced off its 79.50 support.
Other factors to consider: the S&P 500 is overextended and likely to pull back or trend sideways. As previously mentioned, 1166 is still a valid resistance for the S&P. A pullback in stocks will likely reduce risk appetite which may help the USD gain vs. the commodities currencies and further boost the dollar. In addition, there's some speculation regarding another unscheduled discount rate hike. The last hike was unscheduled and occurred exactly one month ago.
Taken together, the evidence is pointing to a stronger dollar on the backdrop of risk aversion.
CLICK ON CHART TO SEE LARGER IMAGE

Wednesday, March 17, 2010
Too Cautious?
My weekend review contained more than a grain of caution. However, market news and price action since Monday were quite positive. The sanguine mood set in on Monday when Senator Dodd revealed his financial reform blueprint, which the market found less than threatening. Stocks rallied immediately following Mr. Dodd's press conference and S&P futures drifted higher overnight. On Tuesday, the market received another boost, this time, from the FOMC. The Fed delivered another shot of adrenaline as it maintained its "extended period" language. The S&P 500 broke above its 1150 resistance and today (Wednesday), a lower than expected inflation reading pushed the broad market higher.
Let's take another look at the weekend hypotheses and see how they measured up so far:
1. Greece bailout and FOMC statement to set the tone for the week - hawkish "surprises" will set the stage for stronger dollar and pullback in risk appetite - Greece's bailout turned out to be more of a mess than anything else, but sometimes it's the thought that counts. At least for the first two trading days of week, concerns over Greece abated to some degree. Sending the euro higher.
The Fed, however, did not deliver any hawkish surprises in its statement. In fact, since the market was bracing for a possible hint of tightening, equities rallied in relief and the dollar slumped.
2. S&P500 at major resistance level. Break above 1150 expected to be capped at 1166. The more likely scenario, is sideways consolidation or a pullback to key support (1130, 1112). - The S&P did indeed break above 1150 and so far, capped exactly at 1160. Coincident? maybe, but we'll know more by the end of the week.
3. Expect a limited euro rally but capped at 1.3850 or 1.4000. - we did get a bounce in the euro. As of this time, it seems that euro was unable to break 1.3800 and is starting to head back down.
4. GPB priced in for a worst case scenario - as such, counter-trend bounce should not surprise but capped at 1.5550 - GBP bounce back did materialize aided by a better than expected UK unemployment numbers. We should still expect to see selling into GBP rallies.
5. Japanese hints of intervention and easing concerns over Greece, should keep yen on the decline. Any yen rallies should be limited. - USDJPY is pretty much flat since Sunday despite Tuesday's (Japan Wednesday) BoJ commitment for further easing to fight deflationary forces. The yen did loose some ground to the loonie and aussie. At this point, my assumption is that yen strength is a function of repatriation and that yen will continue to decline.
6. Loonie - ever closer for parity.
My view is that caution is still warranted. The recovery is still vulnerable and there are multiple single points of failure. Moreover, Mortgage Backed Securities (MBS) purchases by the Fed are scheduled to end this month and no one can tell for sure what impact it will have on the housing market (presumably, not a good one). Further tightening measures by China can also spook the markets and the eventuality of the Fed's tightening will have to set in at some point.
Sunday, March 14, 2010
Beware the Ides of March
-------------Weekly Summary-----------
1. Greece bailout and FOMC statement to set the tone for the week - hawkish "surprises" will set the stage for stronger dollar and pullback in risk appetite.
2. S&P500 at major resistance level. Break above 1150 expected to be capped at 1166. The more likely scenario, is sideways consolidation or a pullback to key support (1130, 1112).
3. Expect a limited euro rally but capped at 1.3850 or 1.4000.
4. GPB priced in for a worst case scenario - as such, counter-trend bounce should not surprise but capped at 1.5550
5. Japanese hints of intervention and easing concerns over Greece, should keep yen on the decline. Any yen rallies should be limited.
6. Canadian dollar set for another swing at parity with USD.
----------------------------------------------------------
Beware the Ides of March
OK - clearly not the most original headline for a blog post on March 14 but a fitting one nonetheless. As we enter the second half of March, we find the Market in a precarious position and the bulls and the bears at an impasse. This time last year was fortuitous for market participants holding long positions in stocks and high yielding bonds and currencies. After a seven month free-fall, the downside risk was limited, if only by the end-of-the-world sentiment that was baked into cake. When perception changed and market participants realized the end of the world was not quite ready to manifest itself, a dramatic rally in "risky" assets ensued fueled further by massive, unprecedented amounts of cheap money pumped into the global economy.
But after twelve months of remarkable gains, the stock market rally is more mature and its momentum has waned due to lingering concerns over sovereign debt, commercial RE, tentative consumer demand, the eventuality of monetary tightening and the uncertain consequences of central banks' exit strategies. Clearly, this year the risk is more to the downside or, at least some sideways consolidation. Even a breakout above 1150 is no guarantee for extended rally. In fact, strong resistance zones loom just above the 1150 level. And 1225 is a major resistance zone marking a confluence of technical analysis elements (resistance lines, 68.8% Fibonacci retracement level, major moving averages). The combination of technical resistance and questionable fundamentals will no doubt keep risk appetite at bay.
Whether or not we will see the S&P break decisively above 1150 is impossible to predict. However, it is safe to assume that a major move will not take place prior to the FOMC statement on Tuesday. From the data we have, we can expect a more hawkish remarks that may spook the market. We will find out if others at the Fed adopted Mr. Hoenig's hawkish views. Actually, we should expect some hawkish "surprise".
Of course, hawkish remarks from the Fed could be interpreted as a sign of strength and a validation of the recovery - but this is the least likely scenario. Over the past months one could have observed on numerous occasions the close link between the risk trade and loose monetary policies. So where does that leave us?
S&P 500 - The Trend is Your Friend (until it ends)
To get a better understanding, we must zoom out and look at the bigger picture. First, let's look at the weekly chart. Despite a slight negative divergence with the RSI, the chart still looks bullish and a break above 1150 is still within reach.

But what if we break above 1150? For that answer, we must look back to September 2008, the last time the S&P held such lofty levels. We can see from the chart below (the image is spliced to fit the screen) that the real supply zone looms at the 1166 level - the origin of a huge move down. 1166 is as critical (if not more) as 1150 and we are only a few points away.

Bottom line, the S&P is still in "the mouth of the dragon" with sideways consolidation and/or limited pullback to key support areas (1130, 1112)being the most likely scenario. Any upward moves are likely to be capped at 1166.
USD - Time to Move
As expected, the DXY pulled back slightly, stopping just shy of our 79.50 target. After 34 days of sideways consolidation, we can expect the dollar to choose a clear direction. The dollar index COT graphs reveal sustained elevated levels of net long positions. This is inline with the sustained extreme net-short positions for the euro and GBP. In recent weeks, we referred to the USD as win-win on the notion that both highly positive or highly negative economic readings could send the dollar higher. In the short term, we can expect the dollar index to pull back on better than expected economic readings which may ease fears in the EU and the UK while worse than expected readings and/or hawkish Fed statement will send the dollar higher against all but the yen. Key support level for the DXY remains at 79.50
Euro - Shelter from the Storm?
FT reported this weekend that a EU bailout for Greece was in the works. Details are still scarce but we should know more by tomorrow (Monday). A bailout for Greece may provide the euro brief reprieve but rallies expected to be shallow and capped at 1.3850-1.4000. Obviously any bailout from Germany will be contingent upon austerity measures which have already stirred massive strikes and demonstrations across Greece. Euro sentiment remains bearish and the high probability trades would be to short the euro against the US dollar at key resistance levels (1.3850, 1.4000)
GBP -
The worst performing major currency seems to be priced for a worst case scenario. As such, it will not be surprising to see the pound staging a little bounce - especially if we get a dovish Fed statement. GBPUSD could be a good long if it comes back to test 1.4880 or on a break above 1.5230. Just like the euro, GBP sentiment is still bearish and rallies are likely to meet renewed selling pressure. 1.5550, 1.5350, and 1.5200 look like decent levels to short GBPUSD
Yen - Deja Vu All Over Again
Last week we noted our expectation for the yen to weaken against the strong aussie and loonie. That scenario played out nicely. Surprisingly, the yen decline vs. the US dollar was a lot milder as USDJPY finished the week only slightly up. Also, we noted surprising net-long positions among the Commercials both in the recent COT report and last week's. This could be reflecting expectations for temporary yen strength due to repatriation or a bet on a risk aversion sentiment. Whatever the case may be, going long yen may be perilous. Japanese officials already made commented on the yen's recent strength. Any hints of intervention may be enough to cause temporary but sharp declines in the yen.
And the Oscar Goes to....the Loonie!
The Canadian dollar finished another impressive week with gains across the board. Similar to the Aussie, the Canadian dollar has enjoyed the surge in commodity prices (namely, gold and oil). But unlike Australia, Canada's interest rates have yet to be tightened. In addition, further Chinese tightening are perceived to pose greater risk to Australia than to Canada. USDCAD broke a major support last week (1.0200) and is well on its way for parity, its next resistance level.
Saturday, March 13, 2010
Commitment of Traders (COT) Reports - 03/09/10
New Commitment of Traders (COT) graphs. This is the March 12 report (data as of Tuesday, March 9). Graphs display net positions for Commercials, non-Commercials, and non-Reportable traders.
Little changed since last weeks reports so we'll keep comments short. Strong net-long position are still evident in the S&P500 report as well as the dollar index, while the GBP and euro are still at extreme net-short positions.
The aussie dollar and the loonie are still gathering strength as speculators added to their net long positions - now at extreme levels.
Perhaps the only surprise this week is the Japanese yen COT report. It shows and increased net-long position which is quite contrary to what we'd expect.
CLICK ON THE GRAPHS TO ENLARGE
S&P 500 (e-mini) COT Report

US Dollar Index (DXY) COT Report


Australian Dollar (AUD) COT Report

Canadian Dollar (CAD) COT Report

Japanese Yen (JPY) COT Report

Little changed since last weeks reports so we'll keep comments short. Strong net-long position are still evident in the S&P500 report as well as the dollar index, while the GBP and euro are still at extreme net-short positions.
The aussie dollar and the loonie are still gathering strength as speculators added to their net long positions - now at extreme levels.
Perhaps the only surprise this week is the Japanese yen COT report. It shows and increased net-long position which is quite contrary to what we'd expect.
CLICK ON THE GRAPHS TO ENLARGE
S&P 500 (e-mini) COT Report

US Dollar Index (DXY) COT Report

Euro COT Report

British Pound (GBP) COT Report


Canadian Dollar (CAD) COT Report

Japanese Yen (JPY) COT Report

Subscribe to:
Posts (Atom)

